
SUMMARY
Change is the only Universal Constant. I had described not too long ago about a very famous Guru who fell into the trap of analysis myopia by calling for Dow 400 crash from March of 2009 to 2014 while the market just roasted all his permabear calls. It wasn't pretty as he was simply unwilling to change his views with the change in market trend. This was a severely important lesson for me just by observing this man's slow train crash for almost five years straight!
To that end, IF my primary count and direction becomes less so compared to an alternate, I change my analysis, without reservations! This has saved my bacon countless number of times. It doesn't mean to become wishy washy without a spine; but rather, be on guard from falling into the myopia trap.
Bitcoin (BTC) overnight action has about returned price to the bottom support line of the triangle. As discussed yesterday on the triangle a,b,c,d,e and the bear flag potentials; I'm adding a third for a zig zag (5,3,5) type of correction. This correction couples the bear flag pattern but can act ahead of the E wave. The E wave had been discussed as the last wave for the bear flag.
The below chart shows the didactic draw out of the zig zag correction as red waev A haveing five subwaves; B having three subwaves and C having five subwaves. These subwaves are then labeled onto the price chart. IF the lower lin of the triangle support is breached and $11,600 is reached; then this Zig Zag could be in effect. The bottom triangle line has held as support well so far, but each time it is hit, it weakens. It's currently being hit for the fourth time. Price action today could show whether it holds as is expected. Now, a bull wick is potential in that price briefly pierces the lower line causing many to panic sell and soon afterwards, price returns right back inside the triangle. Such is the way the market gets rid of the weak hands quickly prior to resuming the original up trend. A Bull Wick would be welcome!
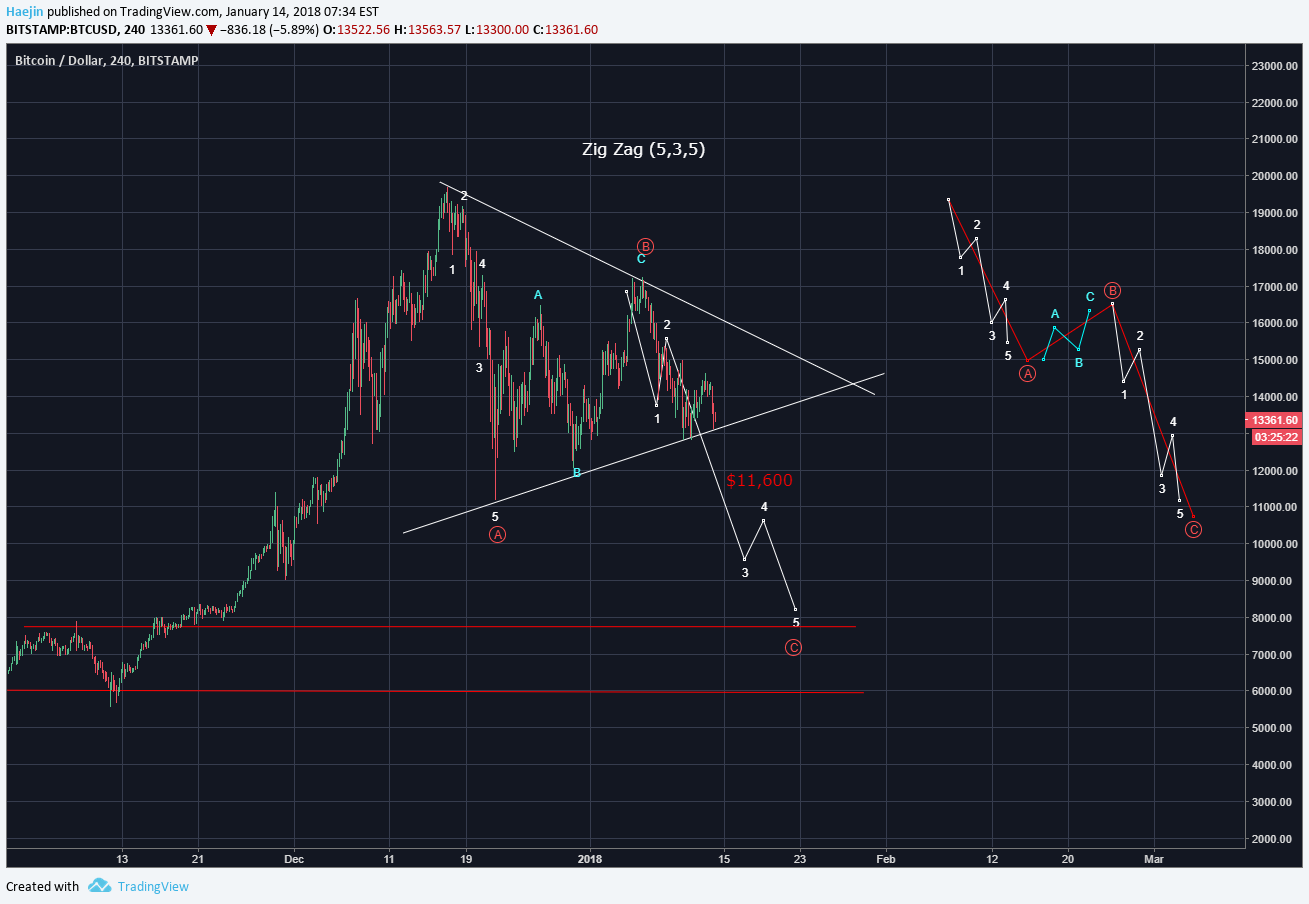
I've drawn horizontal lines for additional landing zones for the bottom of red C wave. These had also be used during the June/July and the early Fall corrections.
The key here is to not panic but perceive it from the stance of confidence and awareness. You are now aware of this scenario and that should not induce fear but rather keep the panic away. IF this scenario takes place, having cash at hand is always ideal! In my blog post that discussed a model portolio, it was suggested that 10% to 15% of a portfolio should be in the form of cash which could be deployed at such bargain basement prices following an a,b,c correction. Why? The best time to buy is at the terminal end of an a,b,c correction!
Please consider reviewing these Tutorials on:
Elliott Wave Counting Tutorial #1
Elliott Wave Counting Tutorial #2
Elliott Wave Counting Tutorial #3
Laddering and Buy/Sell Setups.
Laddering Example with EOS
Tutorial on the use of Fibonacci & Elliott Waves
These Technical Analysis Books: Elliott Wave Priniciple & Technical Analysis of Stock Trends are highly recommended
@haejin's Trading Nuggets
Essay: Is Technical Analysis a Quantum Event?
Follow me on Twitter for Real Time Alerts!!
Follow me on StockTwits for UpDates!!
--
--

If this blog post has entertained or helped you to profit, please follow, upvote, resteem and/or consider buying me a beer:
BTS Wallet - haejin1970
BTC Wallet - 1HMFpq4tC7a2acpjD45hCT4WqPNHXcqpof
ETH Wallet - 0x1Ab87962dD59BBfFe33819772C950F0B38554030
LTC Wallet - LecCNCzkt4vjVq2i3bgYiebmr9GbYo6FQf

Legal Disclaimer: This is only my opinion, make of it what you wish. What does this mean? It means it's not advice nor recommendation to either buy or sell anything! It's only meant for use as informative or entertainment purposes.